LiFePO4 batteries have distinct characteristics that set them apart from other lithium-ion chemistries, particularly in terms of voltage behavior during charge and discharge cycles:
Flat Voltage Curve: Unlike traditional lead-acid or other lithium-ion batteries, LiFePO4 batteries have a relatively flat voltage curve during discharge. The voltage remains stable over a wide range of the SOC (from about 90% to 20%). This characteristic provides a consistent power output but makes it challenging to estimate SOC based solely on voltage readings.
Safety and Longevity: LiFePO4 batteries are inherently safer than other lithium-based batteries due to their thermal and chemical stability. They also support more charge and discharge cycles, often between 2,000 and 5,000 cycles, depending on the usage pattern.
State of Charge (SOC) Monitoring in LiFePO4 Batteries
Knowing the SOC of a LiFePO4 battery is vital for several reasons:
Prevention of Over-discharge and Overcharge: Over-discharging can lead to permanent damage to the battery cells, while overcharging can degrade the battery over time. Proper SOC monitoring helps avoid these conditions, ensuring the battery operates within its safe voltage range.
Maximizing Battery Life: By keeping the battery’s charge within optimal levels (generally between 20% and 90%), users can significantly extend the battery’s life.
Optimizing Performance: SOC estimation ensures that devices powered by LiFePO4 batteries receive consistent power, improving overall system efficiency.
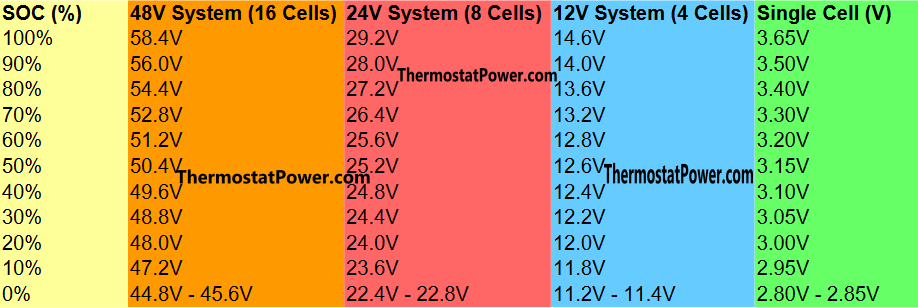
LiFePO4 State of Charge (SOC) and Voltage Correlation Table
LiFePO4 SOC can be estimated based on the battery’s voltage. However, due to the flat discharge curve, the voltage differences between certain SOC levels (particularly between 20% and 90%) are minimal. Here’s a general overview of how the voltage corresponds to the SOC of a LiFePO4 battery:
| SOC (%) | 48V System (16 Cells) | 24V System (8 Cells) | 12V System (4 Cells) | Single Cell (V) |
|---|---|---|---|---|
| 100% | 58.4V | 29.2V | 14.6V | 3.65V |
| 90% | 56.0V | 28.0V | 14.0V | 3.50V |
| 80% | 54.4V | 27.2V | 13.6V | 3.40V |
| 70% | 52.8V | 26.4V | 13.2V | 3.30V |
| 60% | 51.2V | 25.6V | 12.8V | 3.20V |
| 50% | 50.4V | 25.2V | 12.6V | 3.15V |
| 40% | 49.6V | 24.8V | 12.4V | 3.10V |
| 30% | 48.8V | 24.4V | 12.2V | 3.05V |
| 20% | 48.0V | 24.0V | 12.0V | 3.00V |
| 10% | 47.2V | 23.6V | 11.8V | 2.95V |
| 0% | 44.8V – 45.6V | 22.4V – 22.8V | 11.2V – 11.4V | 2.80V – 2.85V |
How to Estimate SOC for LiFePO4 Batteries
Using Voltage: The above table gives a rough estimate of SOC based on voltage. For example, a fully charged single cell will show a voltage of around 3.65V, while a fully discharged cell will have a voltage around 2.8V to 2.85V. For 12V, 24V, and 48V systems, the voltage is simply the sum of individual cell voltages in series.
Flat Voltage Region: Due to the flat voltage region (around 3.30V to 3.40V per cell), it’s harder to accurately gauge SOC using voltage alone within the mid-range (20%-80% SOC).
Battery Management Systems (BMS): Many LiFePO4 battery systems come equipped with a BMS, which uses advanced algorithms to monitor SOC more accurately by factoring in voltage, current, temperature, and charge/discharge cycles.
Coulomb Counting: This method involves tracking the current flowing in and out of the battery to estimate the remaining capacity. It’s often more accurate than using voltage alone, especially for LiFePO4 batteries with their flat discharge curves.